Merchant Transactions - FlexStats
The Merchant Transactions - FlexStats report provides comprehensive information about income and deductions and offers a variety of filters for data customization.
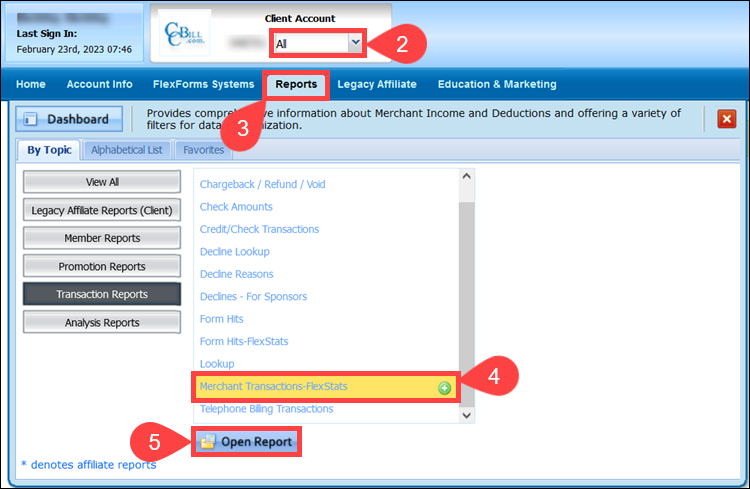
To access the report:
1. Sign in to the Admin Portal.
2. Use the dropdown menu to select an individual subaccount or select All to review data for the entire account.
3. Click Reports.
4. Select Merchant Transactions - FlexStats.
5. Click Open Report.
Quick Stats
The top of the report is dedicated to Quick Stats. The stats are displayed for Today, Yesterday, Week-to-Date, Month-to-Date, Last Pay Period, and Year-to-Date, with Year-to-Date being the default for the graph below.
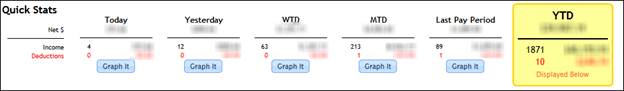
Each individual breakdown displays the following:
- Net. The net amount earned for the selected account or subaccount during the indicated time frame. The net amount displays immediately beneath the time period name (WTD in this example).
- Income. This first row below the header information displays how many transactions were completed during the time period and the total amount of those transactions in USD.
- Deductions. This line, displayed in red, indicates how many deductions were taken from the selected account during the time period indicated and the total amount of those deductions.
The Graph It button below each time period allows you to quickly load a graph based on that particular time period.
Working with Merchant Transaction Graphs
The graphing tools are located immediately below the Quick Stats section of the report.
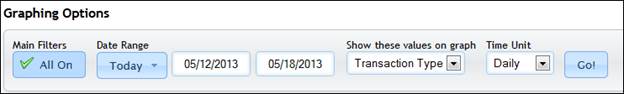
A Year-to-Date graph is displayed for you by default, but many other graphing options are available to you for viewing detailed information about transactions of any type.
Running the Graphs
The following sections explain the various options available to you when selecting graphing options. Once you’ve selected all your desired options select the Go! button to load the customized graph.
Main Filters
The graph displayed is fully filterable, allowing you to design a graph with only the data you care about. By default, ALL options are pre-selected for you. You may change the data you wish to have displayed in the graph by clicking the All On button.
Clicking the button loads the filter settings for the graph. You can deselect any unwanted items in the Transaction Types column and the Payment Types column, and you can choose to filter by Days of the Week and Countries as well.
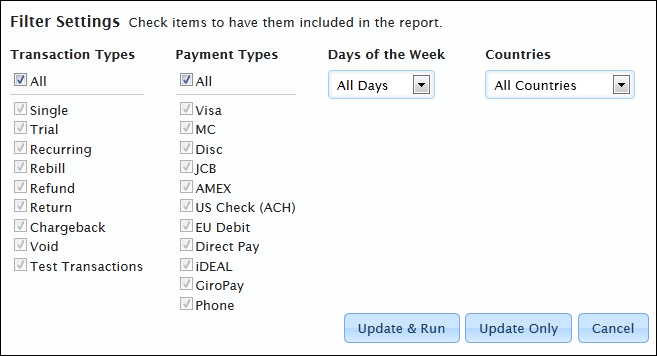
Once you have selected all the desired options, click one of the action buttons at the bottom:
- Update & Run. This option closes the filter options and immediately runs the report with the new filters.
- Update Only. This option saves your filter choices and returns you to the Graphing Options to select further options for the graph run.
- Cancel. This option disregards your changes and removes the Filter Settings menu from view.
Date Range
The Date Range menu allows you to select specific dates for inclusion in your graph or to create a custom date range. To activate this filter menu click the button under Date Range in the Graphing Options (the button label changes based upon your selections).
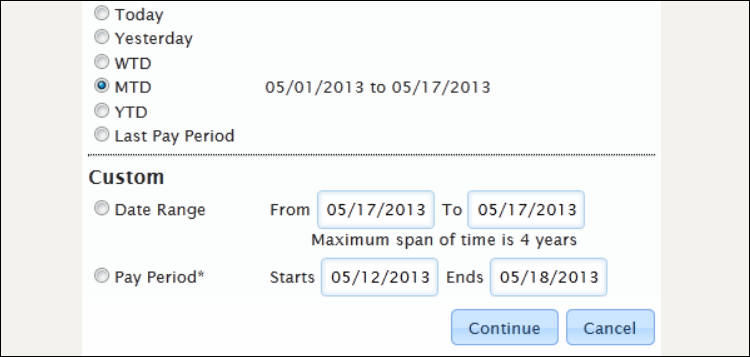
After selecting or entering your date range information click one of the following buttons:
- Continue. Selecting this option saves your choices and returns you to the main Graphing Options menu.
- Cancel. Discards your changes and returns you to the main Graphing Options menu.
You can easily change the date range without using this drop-down by entering your own custom date range in the two fields next to the drop-down in the Graphing Options menu.
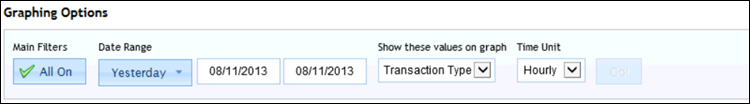
Values
The dropdown menu beneath Show these values on the graph allows you to decide which values you want to view. Select from the following:
- Transaction Type
- Payment Type
- Region
- Currency
- Affiliate ID Yes/No
Time Unit
The report can display data in the following time units:
- Hourly
- Weekly
- Daily
Chart Tweaking, Use, and Legend
Once you have loaded a customized graph you can use the options on the left of the graph to further refine your view.
The Scale section allows you to toggle the graph between Count and Amount. This shows how many transactions of the selected type were performed and the total of the transactions of the selected type. Selected scale information is represented as the X-axis of the resulting chart.
The Time Unit section allows you to quickly break the graph down into other time units. Be aware that time units can make the graphs difficult to read when you select a broad time range in the Graphing Options and then select a detailed time unit from this menu. Viewing hourly data is best done with a daily graph as opposed to a WTD, MTD, or YTD report. The time unit is represented as the Y-Axis of the resulting chart.
These charts are very interactive. If you hover over any point on the chart, it will provide you with pop-up details about that plotted point.
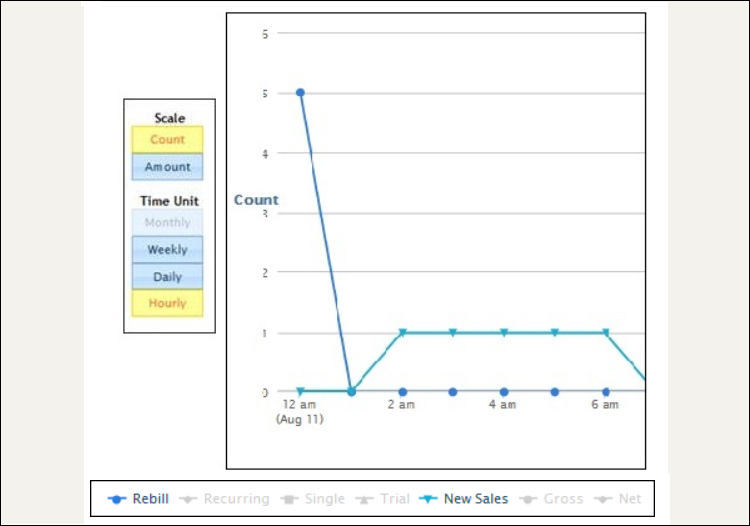
The bottom of the chart provides you with a legend for the plotted data to help you better understand your chart.
On the legend below, the greyed-out icons indicate items not included in the chart. The items in color indicate that both Rebills and New Sales are included in the chart above, and display the line color and plot icon used for those transaction types in the chart.
Working with Graphs
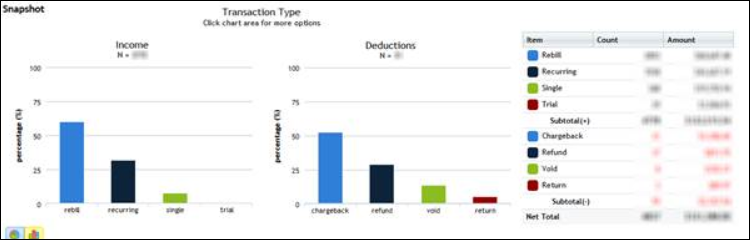
For each action done through the graphing options above, the system loads not only the chart that you see immediately but if you scroll down, you’ll see that it also loads a Snapshot Graph based on your options and a Legend/List that provides more details.
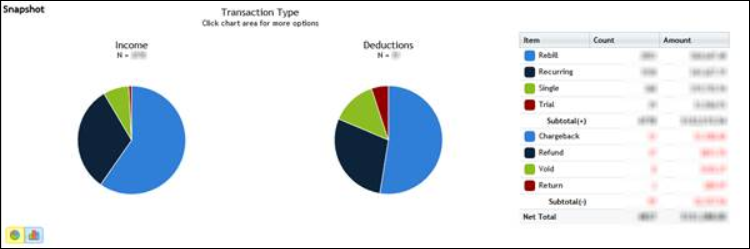
The graphs are very attractive and display income and deductions—color-coded to include rebills, recurring, single, trial, chargeback, refund, void, and return transaction types. The pie chart default can be changed to a bar chart by selecting the icon at the bottom left of the screen.
As with the charts above, hovering over an item in either report will provide you with further details about the graph area.
Breakdown By
If you have experience with CCBill’s reporting system, you know that there’s always a way to break down reports further. With these new reports the Breakdown By happens in pie or bar charts.
After loading the report, scroll to the bottom and locate the item on the graph that you wish to view breakdown details about, then click on that item. A small Breakdown by menu pops up.
Once you select an item from the Breakdown by menu another graph will load at the bottom of the page. In this example, we have broken down Chargebacks by Region.
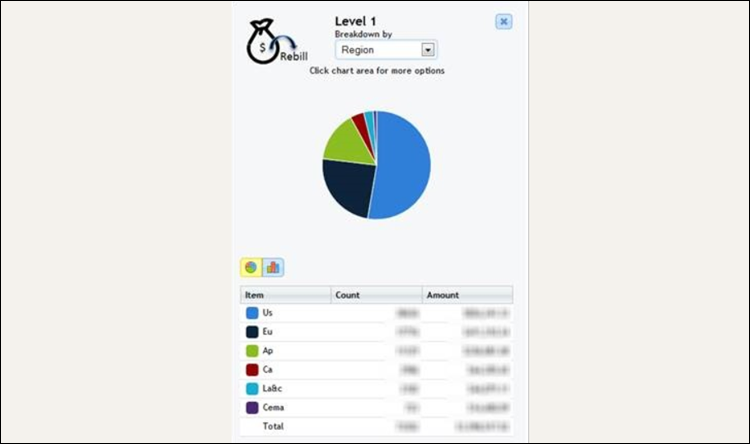
You will notice that again, you have the option at the bottom left of the graph to toggle between pie and bar graphs, and the items in the graph are fully color-coded and defined in the list below the chart.
The Breakdown By drop-down menu can be changed to one of the other available Breakdown by options to immediately refresh the graph with the new breakdown data.
You may further break down this report by clicking on one of the Slices/Bars in the graph and selecting an additional breakdown by option. The new breakdown will load to the right of the original.
Click the X to close any of the breakdown graphs. Additionally, running a new breakdown from the first listed graph will clear the previous breakdown by options from the screen.
Saving Graphs
All of the graphs that you create using the methods above can be downloaded for later use. Click on the icon next to the graph, then select the format in which you wish to save the graph from the drop-down menu.
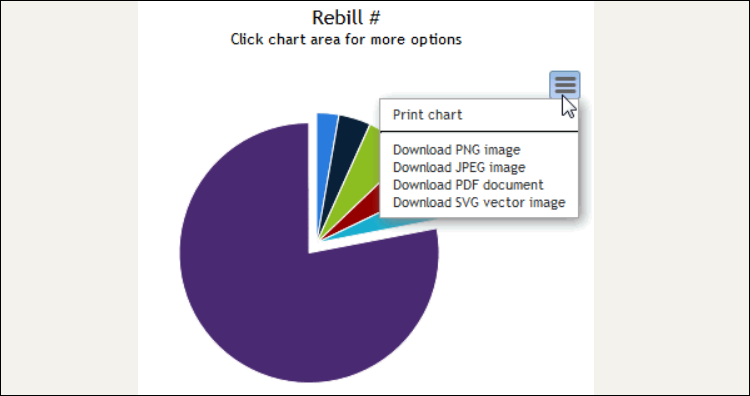
Follow the on-screen prompts to save the file to your computer.